
How to work this course with your AI Assistant
- Open a new conversation That's what I'm talking about. No need to connect a trading account.
- Copy the prompt for each module. It already includes a fictitious case to start with. To use your own information, replace the case with a dated public source or an anonymous document.
- He runs and preserves the answer. If your tool supports files, attach a CSV or document; otherwise paste the table as text. For a chart, provide the data and request axes, units and assumptions.
- Check the result with monitoring values and course charts. A capture can help describe but an exact figure can be checked by a table.
- He called for a concrete correction and repeat the task. That the AI will review itself doesn't replace your check.
The buttons copy instructions. The answer can be obtained by gluing them to your assistants and this page does not automatically check an AI model. Do not share credentials or personal information.
Define with A the horizon and missing data
Solve with A · step by step
- What to give to the AI. Hypothetical Aula Index case: research a trade lasting several weeks; the next relevant event's date is unconfirmed; available sources: twelve invented weekly closing prices.
- What to ask. It creates a tab with horizon, source, outstanding event, review rule and insufficient information. explain why you can't use an event date that isn't provided.
- That's something to check with you. The date should be outstanding. The closures do not report on their own about the business, the liquidity or the costs of maintaining their position.
Propt ready to run
See the expected result and how to fix it
Independent monitoring: The date should be outstanding. The closures do not report on their own about the business, the liquidity or the costs of maintaining their position.
These values are a didactic solution calculated with the case and are not a real response obtained from a model.
Follow-up request: Propones concrete research questions to complete the tab, without filling them with news or supposed dates.
Your AI exercise: run the prompt, compare the response with the monitoring and send the monitoring request. Write down a correct dataset, an omission or limit and how the response changes. If you don't get an error, check two statements anyway.
Concepts to check what the AI responds to
A operation that lasts several weeks or months challenges corporate performance, interest rate changes, opening gaps and news that can come as the market is closed. The term isn't just a label: it determines how much you review the hypothesis, how soon you need the money and how much you can change the price without giving you time to act.
We'll use a fictitious asset called Index Aula. The course focuses on the method, not a sign. The CNMV recommends defining term and risk as referred to in Article 3 (3) (g) and (3) of Regulation (EC) No 1065 / 2006. If you use a leveraged product, its costs and risks change greatly and check its conditions before any decision.
Fiche prior to a simulated operation
- Universe: product, time, currency and liquidity.
- Horizon: how many weeks will you review and what an important event falls inside.
- Retirement: observable data that would support the stage and data that would invalidate it.
- Departure: prices or closing conditions with a margin for worse costs and worse executions.
- Exhibition: what other assets in the portfolio would be moved by the same risk.
Exercise (1 minute). If a company published results within two weeks, write what information you would consult earlier and what you would do if you did not know the exact date. Don't figure that AI knows her: check the official schedule.
Requests A A a Reducible Weekly Chart
Solve with A · step by step
- What to give to the AI. Fictitious weekly closures in euro: 50, 52, 54, 53, 56, 58, 55, 59, 57, 60, 56, 54. Educational reference: 55 €.
- What to ask. Deliver a table week / closure / difference from 55. If you can, generate a graph with a weekly axis and coin. It describes the last closure and what cannot be concluded. Do not use future weeks to define a rule at S7.
- That's something to check with you. S12 closes at 54 €, a euro under reference. That doesn't prove a future fall. For an S7 decision, S8-S12 were unavailable.
Propt ready to run
See the expected result and how to fix it
Independent monitoring: S12 closes at 54 €, a euro under reference. That doesn't prove a future fall. For an S7 decision, S8-S12 were unavailable.
These values are a didactic solution calculated with the case and are not a real response obtained from a model.
Follow-up request: Reconduct the analysis using only S1-S7 and mark all the statements from the previous response that you could no longer make.
Your AI exercise: run the prompt, compare the response with the monitoring and send the monitoring request. Write down a correct dataset, an omission or limit and how the response changes. If you don't get an error, check two statements anyway.
Concepts to check what the AI responds to
The following figure contains 12 invented weekly closures. The tipple line of 55 €is a didactic reference, not a statistically validated level. The last close, 54 €, remains low. A prudent reading describes what happened and raises questions: did there be a change in business, a general market movement or just noise?
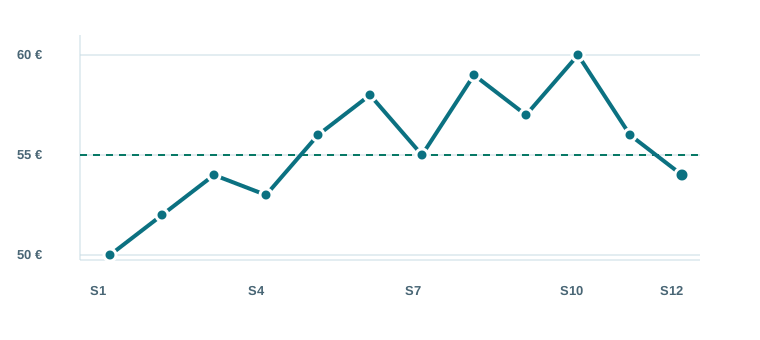
If you draw the reference after viewing the 12 points, you can choose it to make it look explanatory. For a valid test, write the rule using only information available up to decision week. For example, "at the close of S7 I will compare the price with a defined reference with data up to S6." S8 week's still cannot be interacted with the rule.
A mobile mean also sums up old prices and does not anticipate the following. If you use it, select window, frequency, what counts as crossing and what you will do on side markets. To change the parameters till the old figure looks perfect creates an overlap.
Key question: The last closure's under 55 €. That's enough to conclude that the asset will continue to fall? No. Please describe the observation, check dated sources and keep open the possibility that your hypothesis will miss.
Building with AI the adverse stage in euro
Solve with A · step by step
- What to give to the AI. Fictitious case: entry 55 €, invalidation 52 €, target 62 €, 30 units, total costs 6 €. Alternative adverse output by hole: 50 €.
- What to ask. Calculates expected loss, net gain, quotient and loss with output at 50 €. It has a bottom and bottom stage and a worse run without assigning odds.
- That's something to check with you. The results are 96 €, 204 €, 2,125 and 156 €. He's up against his calculator. A written stop doesn't guarantee execution at 52 €.
Propt ready to run
See the expected result and how to fix it
Independent monitoring: The results are 96 €, 204 €, 2,125 and 156 €. He's up against his calculator. A written stop doesn't guarantee execution at 52 €.
These values are a didactic solution calculated with the case and are not a real response obtained from a model.
Follow-up request: It indicates costs that are missing if the product gets financing and leaves its amounts as shown without assuming that they are zero.
Your AI exercise: run the prompt, compare the response with the monitoring and send the monitoring request. Write down a correct dataset, an omission or limit and how the response changes. If you don't get an error, check two statements anyway.
Concepts to check what the AI responds to
To practice, imagine a hypothetical entry at 55 €Invalidation at 52 €, illustrative goal at 62 €, 30 units and 6 €total costs. They're all invented numbers to learn arithmetic. They do not coincide with the last closure of the graph and do not imply that you have to buy.
The goal and invalidation are scenarios, and they are not promise to run. If an opening space was to occur and the actual output was 50 €instead of 52 €, the loss would be 156 €: (55 − 50) × 30 + 6. Having been written "stop at 52" doesn't guarantee to lose only 96 €. There may also be costs to maintain a position, depending on the product.
Educational stage calculator
Educational simplification. He does not estimate his chances, his taxes and his full costs of maintaining his position.
Design with A a chronological proof of the rule
Solve with A · step by step
- What to give to the AI. Teaching rule: at close S7, select the price position with respect to a reference defined with S1-S6. Fictitious data S1-S12: 50,52,54,53,56,58,55,59,57,60,56,54. No openings and costs are provided.
- What to ask. It sets up a test protocol: data used to define the reference, decision time, later entry, costs and limits. Do not claim an executable gain with closures only.
- That's something to check with you. The response should recognize openings and missing costs and avoid using S8-S12 to choose the S7 reference.
Propt ready to run
See the expected result and how to fix it
Independent monitoring: The response should recognize openings and missing costs and avoid using S8-S12 to choose the S7 reference.
These values are a didactic solution calculated with the case and are not a real response obtained from a model.
Follow-up request: He looks for bias to look at the future in the protocol and changes any step using information that isn't currently available.
Your AI exercise: run the prompt, compare the response with the monitoring and send the monitoring request. Write down a correct dataset, an omission or limit and how the response changes. If you don't get an error, check two statements anyway.
Concepts to check what the AI responds to
A historic test is a simulation of how I would have been. Behave a rule. If you choose the rule after you get to know the whole graph, you use information about the future. It secates a period to design and a later period to check without retouching parameters. It includes commissions, differences between prices observed and performed, dividends where applicable and operations that could not be performed.
| Checks | Why does it matter? | What to score |
|---|---|---|
| Prior rule | Avoid Reinterpreting Signs | Date, available and exact conditions |
| Separate period | Reduces adjustment to the past | Design and backstage without change |
| Costs and liquidity | The contribution isn't enforcement | Unfavorable jobs, jobs and jobs |
| Comparison | A cut-off result says little | Simple reference and fall periods |
The SEC explains that retrospective results are hypothetical and that the past does not predict the future. A very convincing graph can be a result of selecting only the favorable period.
Propt 1 · Design an honest test
Check with AI what's changed with the hypothesis
Solve with A · step by step
- What to give to the AI. Initial Fictitious Thesis: The analysis requires to confirm stable income. New information: The price dropped from 60 to 54 €and there's no new income report.
- What to ask. Compare initial condition, new data and allowed conclusion. It's a fall from an exchange rate verified in the business. He writes outstanding questions and a review date chosen by his student.
- That's something to check with you. The fall was 10%, but it did not prove that income had been changed. The AI should demand a document to contrast that fact.
Propt ready to run
See the expected result and how to fix it
Independent monitoring: The fall was 10%, but it did not prove that income had been changed. The AI should demand a document to contrast that fact.
These values are a didactic solution calculated with the case and are not a real response obtained from a model.
Follow-up request: It sets out two alternative explanations labelled as hypotheses and specifies what source you would need to distinguish them from.
Your AI exercise: run the prompt, compare the response with the monitoring and send the monitoring request. Write down a correct dataset, an omission or limit and how the response changes. If you don't get an error, check two statements anyway.
Concepts to check what the AI responds to
In several weeks they can change the facts that hold an idea. It creates a register with the date of each review, new data, its source, original hypothesis and decision made. He asked the AI to point to contradictions but did not delegate the order or accept data without an appointment. The ESMA warns about the risk of misinformation or up-to-date information at AI tools.
Propt 2 · Weekly review
Check what you have learned
1. What's the loss if the example goes to 50 €instead of 52 €?
(55 − 50) × 30 + 6 = €156. Exceeding 96 €with an output at 52 €.
2. Why can't you use S8 week to design an S7-evaluated rule?
Because at S7 that information still did not exist. Using it bias the test with knowledge of the future.
3. Can a close under €55 prove that next week will fall?
No. That's a descriptive information about the case. That's a missing context, events and valid proof of the rule.
Performance of the course
Now you can read a weekly series, leave an invalidation written, compute an worse output and design a review without changing the rules after viewing the result.
Back to course →Sources for deepening
- CNMV: term and investment risk.
- SEC: how to evaluate performance claims.
- ESMA: warning about AI and investment.
Educational content with fictitious prices. It does not constitute financial advice or an investment recommendation.